Graph theory
Well placement
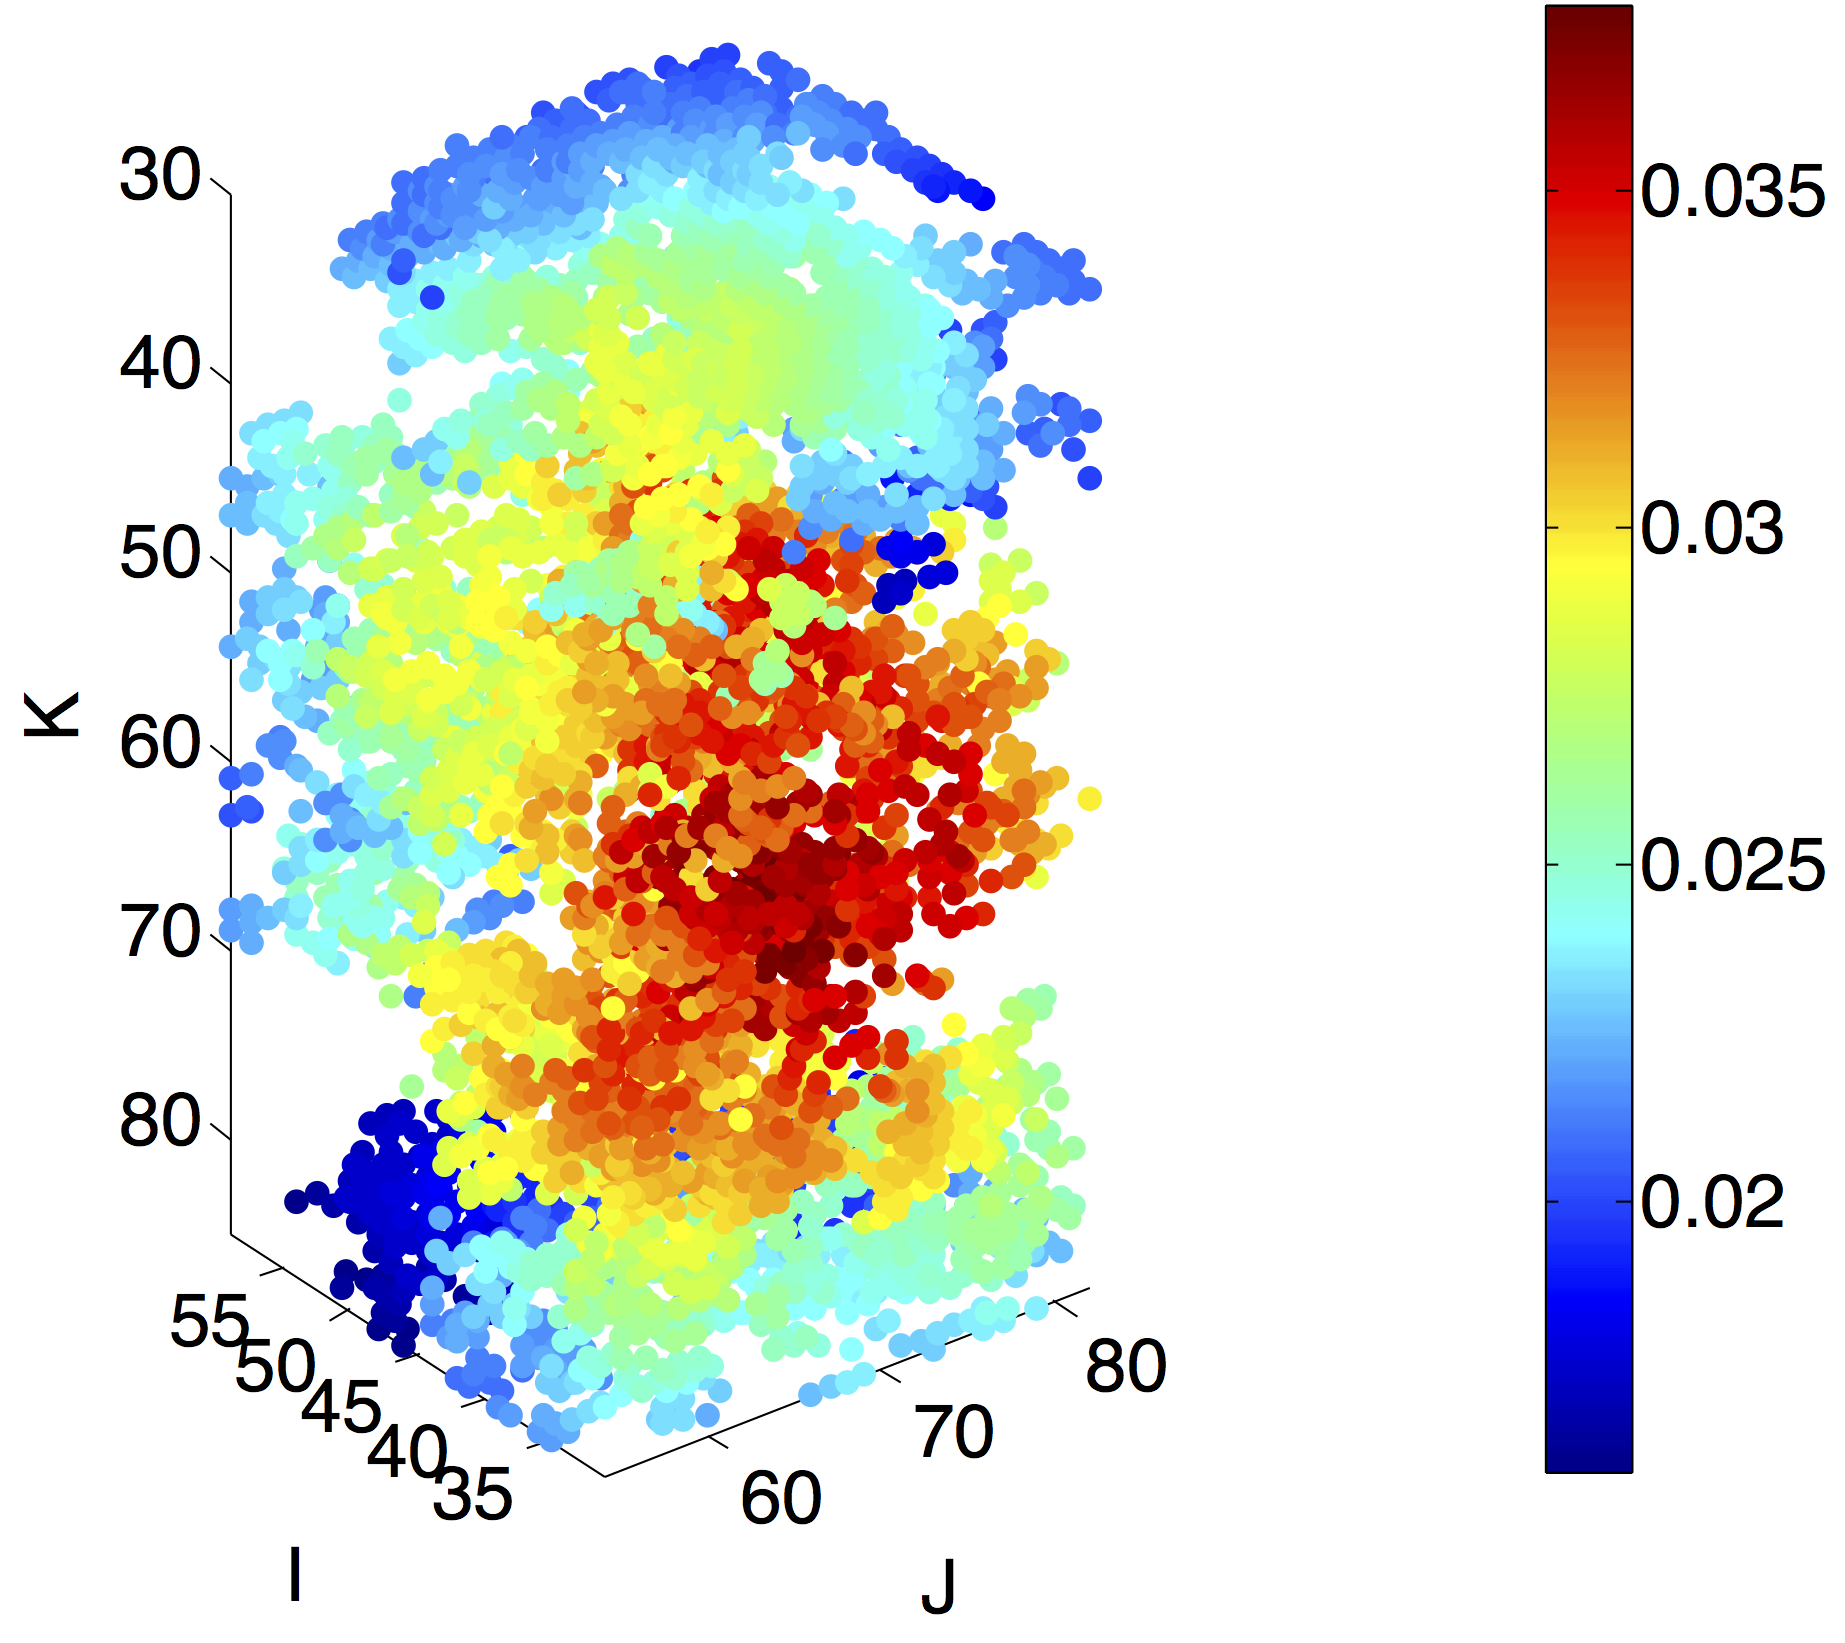
This figure is a "spot" of values that classify the local regions inside a petroleum reservoir as being of higher or lower consideration to implement well placement strategies for oil recovery based on the closeness centrality concept from graph theory. The red points make up a volume where the mathematical property stands out, thus suggesting that it is a region to be considered for production analysis.